
Engagement Analytics
The Aula team released a feature to enable educators to analyse student engagement in order to make adjustments as the module progresses.
Introducing Engagement Analytics
It’s called Engagement Analytics and according to the Aula support documentation it helps you keep track of some of the following metrics:
- Space
- Percentage of active students, average number of days active, students active and engagement by week, materials view, and student overview.
- Individual Students:
- Last active, feed engagements, material views, daily feed engagement and material views, and assignments.
How to access it
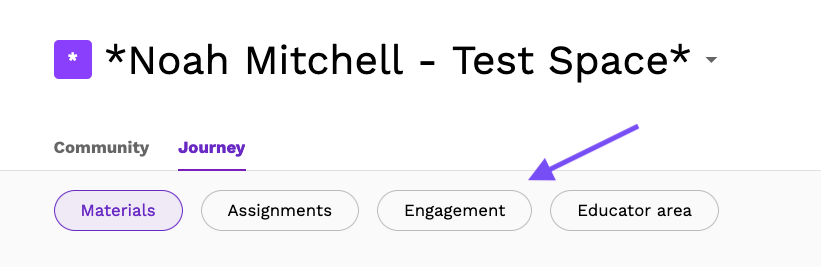
- Navigate to your space
- Click on Journey
- Select Engagement
Further information
The data from the engagement analytics feature should help educators to understand whether students are accessing their module space as well as which posts are the most effective.
You can give feedback on the product portal and report any issues you have to the Aula product support team.
Read more about this feature on the Aula support documentation
Original author: Noah Mitchell
